
An Accurate Simple Harmonic Oscillator Laboratory
Learning Objectives
* Execute a specific experimental procedure to test a specific hypothesis.
* Use the Tracker video analysis software for a simple experiment.
* Analyze the acquired data with a spreadsheet to test the hypothesis.
* Explain in one’s own words whether the experimental data supported the hypothesis, and (if so), how well.
*Use a carefully measured physical quantity from one experiment (the spring constant from Hooke’s Law) to predict an important quantity in a different experiment (the period in the Simple Harmonic Oscillator). See: https://www.physicsforums.com/insights/an-accurate-hookes-law-laboratory/
Introduction
Understanding the simple harmonic oscillator is an essential building block for describing a wide array of physical systems including most things that vibrate, radiate, or oscillate. A straightforward experimental realization of the simple harmonic oscillator is a mass suspended from a spring. When displaced downward a short distance from its equilibrium position and released, the mass will oscillate up and down repeatedly. The period of this motion is independent of the amplitude of the oscillation and it is predicted by a simple formula.
Hypothesis: The period of a simple harmonic oscillator constructed by a mass on a spring is given by T = 2π(m/k)1/2, where m is the mass (in kg) and k is the spring constant (in N/m). The strategy to test this hypothesis is to construct a simple harmonic oscillator with a mass and spring and measure its period using Tracker to see how long it takes to complete 10 full oscillations up and down. The spring constant should have been obtained in the earlier experiment on Hooke’s Law. Due care should be taken to use the same spring in both experiments.
Method
Materials
*1 video camera with file format compatible with Tracker – most cell phone cameras will work as well camcorders
* Free Tracker video analysis program: https://physlets.org/tracker/
* The same spring that was used for the Hooke’s Law experiment
* A range of test masses (4) that can be hung from the spring. Masses should have a range of values so that the heaviest mass is 3-4 times the lightest mass, and the range has (approximately) equal steps over the interval. Some of the same masses used in the Hooke’s Law experiment would be ideal.
* A rigid hook, bar, rod, or other support from which spring may be suspended as masses are hung.
* A lab notebook for recording data.
* A computer, plotting program, and spreadsheet for analyzing data.
Procedure for Experiment
Be intentional about planning masses for this experiment. The video analysis will measure the period to 1/300th of a second or so. Several factors will contribute to your experimental uncertainties. Uncertainties in the video analysis will yield small uncertainties in the period determination. Selecting 4 masses at the heavier end of what you have available will yield longer periods such that the relative error of a given fraction of a second is smaller. Uncertainties in the measurements of your masses will yield uncertainties in your predicted periods, as will uncertainty in your determination of the spring constant from your Hooke’s Law experiment.
Prepare a new page in your lab notebook, putting the date and title of the lab at the top of a new page. Write the value of the spring constant, k, near the top. Include at least 4 decimal places and the units. Your Hooke’s Law lab should have measured Force in Newtons and spring position in meters, so the slope of the line (rise over run) has units of N/m (Newtons per meter). Double-check all this and record the spring constant k something like k = 18.31161 N/m. (Your number will be different.) Now, make two new columns below that for the original data of this experiment. The first column is mass (g); the second column is 10T (s). The 10 T represents the time for 10 periods that you will determine from video analysis.
Set up the video camera pointed at the mass and spring. You need a level of zoom so the video catches the complete range of motion, but you don’t want lots of space in your field of view outside the motion of the test mass. The camera orientation and zoom level may need to be adjusted between test masses.
Now, use your electronic balance to determine the mass of your first test mass. This mass needs to be heavy enough to stretch your spring significantly without hitting the table or support. Now, pull the mass downward a few cm and release it. It should oscillate up and down in the spring. It may take a few tries, but you want the dominant motion to be a simple up and down with minimal side to side motion. If there is much side-to-side motion, stop the mass and try again. Once you have the up and down motion you want, start the video camera and record at least 10 full oscillations. You may want to record 12-15 so you are sure you have 10 complete oscillations to analyze on the video. Once you have your first video recorded, replace the mass with a different one and repeat for all four of your test masses, so you end up with four videos, one with each test mass. The pan and zoom of your video camera may need to be adjusted between masses, as heavier masses will hang lower.
Procedure for Analysis
Transfer the video from the camera to a computer and open a video in the Tracker program. Move forward to the frame just corresponding to the very lowest point on the first recorded oscillation. You may need to step the video forward and back to find just the right frame. When you find the frame corresponding to the furthest motion of mass downward, set the time to zero for that frame. (Note, since the Tracker program is only used for timing, no length scale calibration is needed.)
Now, let the video play forward for 10 complete oscillations (up and down) from where you set time to zero. Stop the video and move frame by frame until you find the frame corresponding most closely to the mass reaching its extremely low position on the 10th oscillation. Record that time in your lab notebook as 10T (ten times the period). The period of the simple harmonic oscillator is the time to bounce up and down 1 time. You allowed the mass to bounce up and down 10 times to increase accuracy. The period, T, can be obtained by dividing the measured 10T by 10. Now, the measured period can be compared with the predicted period and a relative error computed.
Set up columns in your analysis spreadsheet like in Table 1. You will need the spring constant, k, for some calculations, so enter it in a cell near the top. The two leftmost columns [mass (g) and 10 T (s)] should contain your raw data, exactly as you wrote it in your lab notebook. The third column should be the mass converted to kg (divide by 1000 to convert g to kg). The fourth column should be the measured period, T, computed by dividing the measured 10 T by 10. The fifth column should be the predicted period, T, for each mass, computed with a spreadsheet formula like =2*3.1415926*SQRT(C5/$D$1), assuming the spring constant, k, is in element D1 and the mass in kg is in element C5. Note the $D$1 will allow the formula to be pasted into lower cells in the same column and keep the reference to the cell with k. The sixth column contains the relative error between the predicted and measured periods computed as the (Predicted T – Measured T)/Measured T, or =(E5 – D5)/D5.
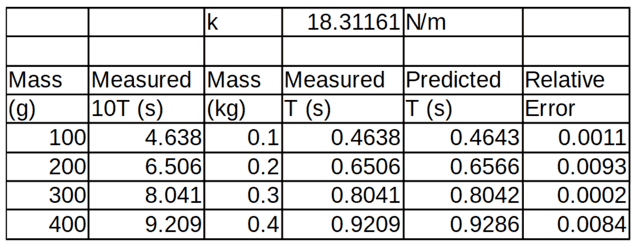
Table 1: Data and analysis for the simple harmonic oscillator comparing measured and predicted periods for each mass.
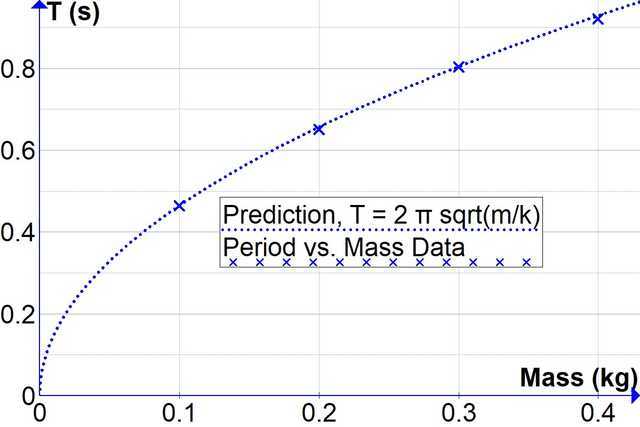
Figure 1: Period T vs. Mass Predictions and measured data for the simple harmonic oscillator.
Results (50 points total)
Your results should include a table containing your measured 10T, the predicted period, the measured period, and the relative error in the prediction. Make sure to record things according to the experiment you performed rather than the example in the instructions or how you think things should have gone. If there is a major discrepancy between your predicted and measured values, you may retrace your steps and try and find where you made the error. The most likely sources of error over 2% are errors in measuring the period, entering wrong values, or an error measuring the spring constant.
Discussion (50 points total)
Your written discussion should be from 1 to 3 paragraphs discussing the following questions in complete sentences:
* Was your hypothesis supported? Why or why not? How strong is the support for the hypothesis? (20 points)
* How much would you need to increase the mass to double the period? (10 points)
* Estimate the period of a simple harmonic oscillator with a spring constant double the one for yours and a mass of 100g. (10 points)
* Estimate the mass of a simple harmonic oscillator with your spring constant and a period of 1.000 s. (10 points)
I grew up working in bars and restaurants in New Orleans and viewed education as a path to escape menial and dangerous work environments, majoring in Physics at LSU. After being a finalist for the Rhodes Scholarship I was offered graduate research fellowships from both Princeton and MIT, completing a PhD in Physics from MIT in 1995. I have published papers in theoretical astrophysics, experimental atomic physics, chaos theory, quantum theory, acoustics, ballistics, traumatic brain injury, epistemology, and education.
My philosophy of education emphasizes the tremendous potential for accomplishment in each individual and that achieving that potential requires efforts in a broad range of disciplines including music, art, poetry, history, literature, science, math, and athletics. As a younger man, I enjoyed playing basketball and Ultimate. Now I play tennis and mountain bike 2000 miles a year.


Including tracking software into education needs to be promoted more. Back in high-school I did a similar experiment with a wheel and a VCR to prove to my teacher that the height of a point on the perimiter as a function of time was a sinusoid, not a cycloid (that’s as a function of horizontal displacement). I still recall going frame by frame.Agreed. With some careful experimental design, getting accurate results with Tracker is just so easy with little more than a video camera and a computer.
Requires students to be able to count to ten. Effectively unusable. :rolleyes:
Just kidding. Even today it is a good experiment. Including tracking software into education needs to be promoted more. Back in high-school I did a similar experiment with a wheel and a VCR to prove to my teacher that the height of a point on the perimiter as a function of time was a sinusoid, not a cycloid (that’s as a function of horizontal displacement). I still recall going frame by frame.